Summer programs participating at the Individualized Support Membership Level will receive an additional page on their PRISM titled “Skill Building Student’s Perspective (HSA, HSA-R).” This page provides a summary of student’s baseline self-assessment and their perceived growth in skills. As with other sections of the PRISM, a comparison is provided to the overall BSLC cohort of students who took the HSA and HSA-R. Explore the dropdowns below for more information on how to read this page of the PRISM.
Summer and school year programs who are participating at the Individualized Support Membership Level will also receive an HSA Dashboard from the PEAR Institute with a summary of their students’ social-emotional strengths and challenges, as well as individual skill portraits for each student. PEAR coaches provide technical assistance and support in interpreting these portraits and dashboards so that programs can use the results to tailor the program to the needs of their students. Summer programs may also opt to use the HSA Retrospective, a tool in which students self-asses their growth in social-emotional skills at the end of the summer program.
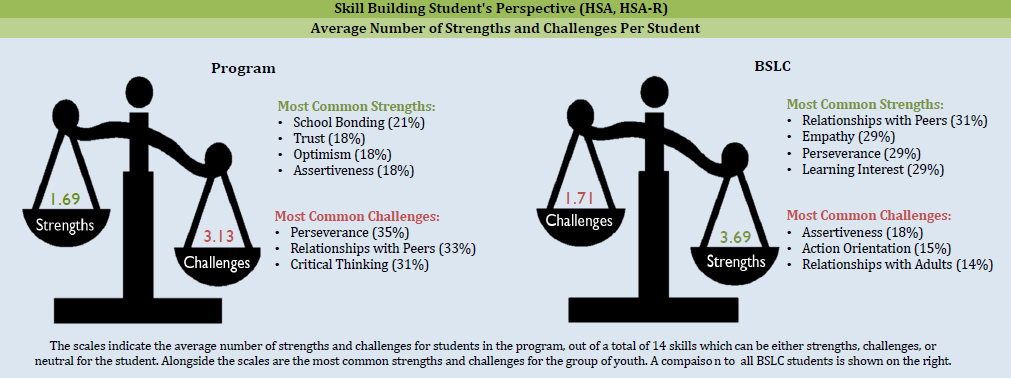
The first section of this page shows, on average, how many strengths and challenges students in the program had compared to the number of strengths and challenges students in the overall BSLC had. There are 14 skills on the HSA, and each skill may be either a “strength,” “challenge,” or “neutral” for the student, based on being normed against students of their age and gender from the PEAR Institute’s national database. This section also lists the most common strengths and challenges of students, along with the percent of students for whom that skill was a strength or challenge.
Based on the number of strengths and challenges a student has, they are assigned to a support need tier: low support need, moderate support need, or high support need. This section of the report shows what percent of the program’s students fell into each support need tier. It also shows the most common strength and challenge by support need tier, followed by the percent of students in that tier for whom the skill was a strength or challenge, respectively. If no one skill stood out as being the most common, then the chart will state “No Skill Outlier.” If the students in the particular support need tier did not have any strengths or challenges, the language in the chart will reflect that.

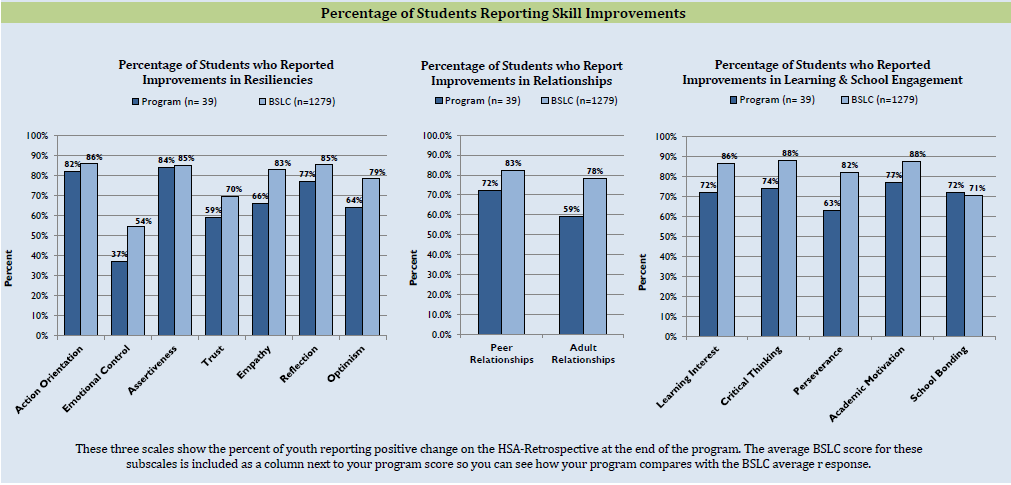
The last section of the report shows the HSA Retrospective data, where students report on how much they think they demonstrate social-emotional skills at the end of the program as compared to the start of the program (1 = much less now, 4 = about the same, 7 = much more now). The graphs on the PRISM show what percentage of students in the program reported improvements (score > 4) for each skill, with a comparison to the overall BSLC cohort of students.