Programs participating at the Youth Outcomes Membership Level and/or the Badging Membership Level will receive this page of the PRISM. This page contains staff ratings of participating youth’s social-emotional skills, both a baseline and development over the course of the program. Similar to program practice ratings, there is a benchmark for the desired frequency of skill demonstration by youth, which is “usually.”
Average Skill Demonstration by Students:
The top section of this page shows the average score for students, by skill, at the program. Programs will receive a green checkmark if, on average, students are “usually” demonstrating the skill. An arrow indicates the direction of change from pre to post assessment of students skill demonstration. The “n=?” column shows the number of students on whom results are being presented in the report. Only students with both a pre and a post survey are included.
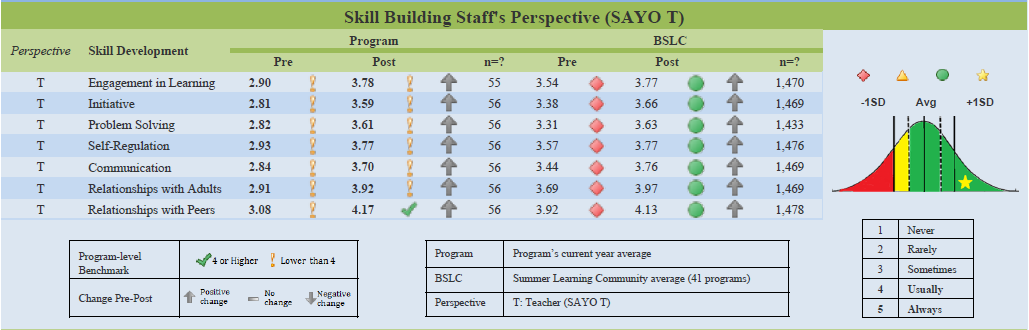
Cohort Comparisons:
A comparison to the average of the cohort (AQP for school year programs, BSLC for summer programs) is provided so programs can see how their students demonstration of social-emotional skills compared to that of all students served by the cohort. Programs should refer to the legend in this section of the PRISM, and additional guidance on how to interpret this symbol is provided here.
- A green circle means the program’s students, on average, are performing within a -0.5sd to +1.0sd range around the cohort average. In other words, the skill demonstration of the program’s students is on par with that of students in the group of peer programs.
- A yellow triangle means the program’s students, on average, are performing within a -0.5sd to -1.0sd range below the cohort average. This symbol indicates the skill demonstration of the program’s students is slightly less frequent compared to students in the group of peer programs.
- A red diamond means the program’s students are performing at greater than -1.0sd below the cohort average, and are doing less well than students in the cohort of peer programs in terms of how often they demonstrate social-emotional skills.
- A gold star means the program’s students are performing at greater than +1.0sd above the cohort average, and are outperforming students in the its cohort of peer programs in terms of how often they demonstrate social-emotional skills.
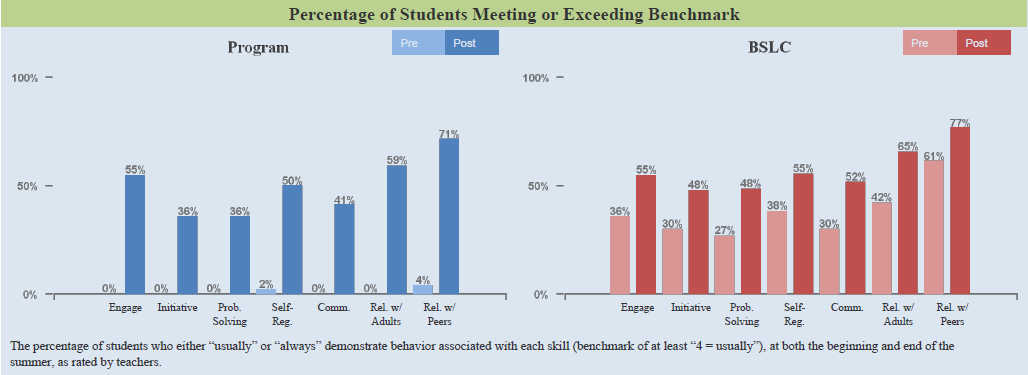
Whereas the top section on this page showed on average whether or not students met the benchmark for frequency of skill demonstration, this section provides a layer of additional information by showing what percentage of students met the benchmark at pre and post assessment.
In the sample provided, students on average were rated at a 3.61 in Problem Solving skills on the post assessment, meaning the frequency with which they demonstrated these skills fell between “sometimes” and “usually.” However, looking at the second section on the PRISM, we see that 50% of students actually met the benchmark in problem solving skills at the end of the program. We can compare this to no students meeting the benchmark in problem solving skills at the beginning of the program. The program can then compare their students to the students in the overall BSLC cohort and see that a similar fraction of students in the overall cohort met the benchmark at the end of the program cycle.
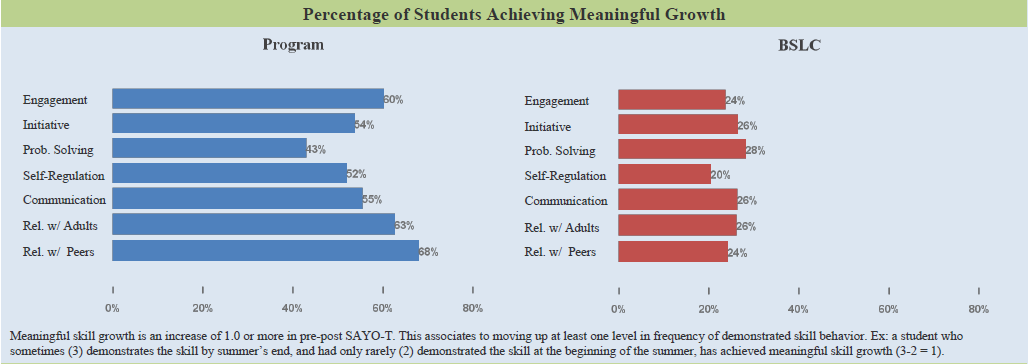
Another way to look at staff ratings of students’ social-emotional skills is by what percentage of students achieved a certain amount of growth in their skill competency levels over the course of the program. For the PRISM, a threshold of meaningful growth is set at a difference of at least one point between the pre and post assessment. This correlates to moving up at least one level on the rubric (1 = never, 5 = always) in terms of frequency of skill demonstration.
For example, a student who “sometimes (3)” demonstrates the skill by the end of the program, and had only “rarely (1)” demonstrated the skill at the beginning of the program, has achieved meaningful skill growth (3 – 2 = 1). So in the sample provided, we can see that anywhere from 43% to 68% of students demonstrated meaningful growth in their social-emotional skills, depending on the skill.
Taking all three pieces of the the “Skill Building Staff’s Perspective” page of the PRISM together, programs have a detailed view of where students began and ended the program in terms of how often they demonstrated skills that have been linked to success in school, careers, and life.
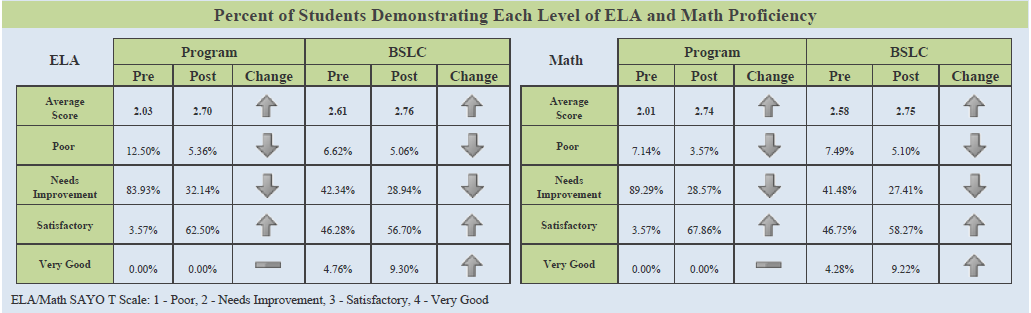
Summer program partners receive an additional section on this page of their PRISM that shows the percent of students demonstrating each level of ELA and Math proficiency as rated by program educators using the SAYO T. An average score is provided for each subject (1 = poor, 4 = very good), and change from pre to post is indicated with gray arrows.
Generally programs should look for the percentage of students in the “poor” and “needs improvements” categories decreasing, and the percentage of students in the “satisfactory” and “very good” categories increasing. A comparison to the BSLC cohort is provided.