The top section of the PRISM contains a general overview of program characteristics, youth participant demographics, and youth participant attendance. Key differences in this section between school year and summer PRISMs are highlighted in the dropdowns below.
The “unknown” variables under gender and demographics indicate the percentage of students for whom Boston After School & Beyond could not match to the Boston Public Schools student information system. If gender and/or demographic information is unknown for more than 25% of students at a program, the gender and demographic sections for the program will be left blank, as the information would no longer be sufficient to accurately represent the characteristics of students in the program.
School year partners will have a bar graph in this section of their PRISM that shows “School Year Attendance.” This is the average rate of attendance of students at their school. For example, in the sample PRISM below, students in the program had a school-day average rate of attendance of 77%. This is different from program attendance. In this sample, students attended their program at an average rate of 82%.
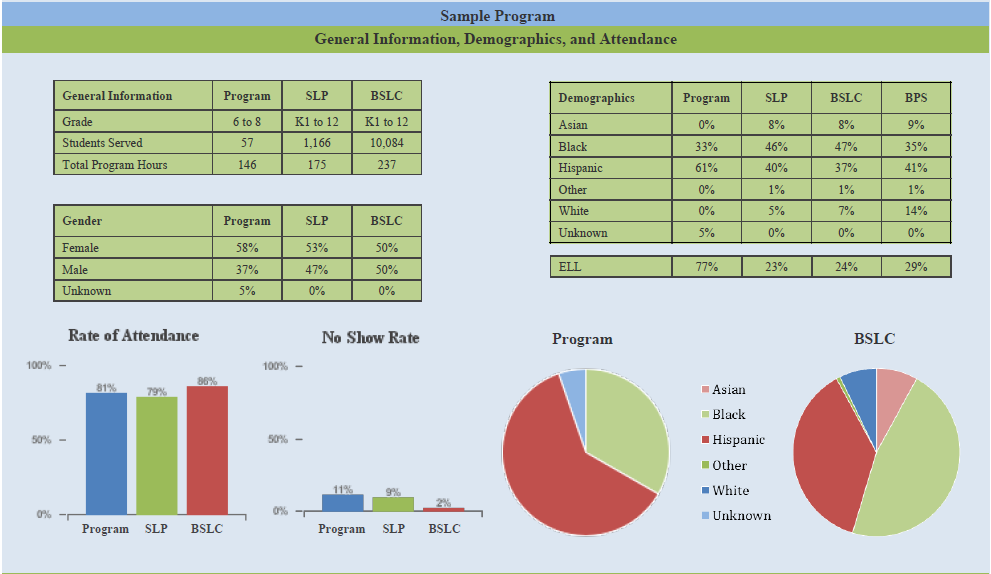
Summer programs will have a bar graph in this section of their PRISM that shows the “No Show Rate.” This is the percent of students who signed up for the program but never attended a single day of programming. In the example below, the program had an 11% no show rate. Accurate no show rates on the PRISM are contingent upon programs uploading all registered students to the Cityspan Provider Database regardless of whether or not they actually come to the program.
Programs should compare their no show rates to their capacity fill rate, i.e., how many seats are filled versus how many seats could be filled. If a program has a capacity of 100 but only 73 seats are filled (73% fill rate), and a no show rate of 11%, the program can determine at what rate they should be over-recruiting to ensure all seats are filled, knowing around 11% of students who sign up for the program are not going to come. On the other hand, if a program has a capacity of 100 and 98 seats are filled (98% fill rate), and a no show rate of 11%, that program has likely already reached a good balance of over-recruiting. The capacity fill rate is not information collected by Boston After School & Beyond and is therefore not included on the PRISM, but should be information programs can obtain on their own. The no show rate would be interpreted differently if programs actively manage a wait-list.